21.2. Results of the automated data classification
The data was classified using
a degree of roughness of 0.3 (a quite detailed description of cases)
and rule precision threshold of 0.5 (rather general
rules). The rules generated by the rough sets system
and the attribute strength report are given in Tables
14 and 15.
Please note, that the ranges of parameter values
given in Table 14 are only interpretable for this
particular experiment and are presented here only for completeness of the
result presentation.
The correctness of the data classification was tested
additionally using the leave-one-out method. As mentioned above, the verification
of the results is possible only for non-rough models. The error rate of
the leave-one-out verification of the data classification for precise model
is about 8%, which is a good result that demonstrates both the high
predictive capability of the parameters used and the strong dependency patterns
(Reduct System, 1993).
-
-
Table 14: Results of the rule generation using the
rough sets method. System setup: Roughness=0.30, Rule Precision
Threshold= 0.50. Abbreviations: f0std - standard deviation of F0 [Hz],
ectm - relative duration of the end of closing [%],sctm - relative duration
of the start of closing [%], otm - relative duration of open phase [%], eotm
- relative duration of the end of opening [%], soam - start of opening slope,
ecam - end of closing slope, peakm - peak-to-peak amplitude, opvm - variation
of the open phase.
|
decision |
rule |
group==> control |
[15.70< sotm<=24.10] & [13.24< otm<=21.52] &
[604.80< ecam<=1717.40] | OR | |[15.70< sotm<=24.10] &
[13.24< otm<=25.65] & [882.95< ecam<=1717.40] |
group==> breathy |
|[scam>120.01] & [21.52< otm<=38.06] & [ecam>1161.10]
& [133.64< f0m<=223.94]
| OR
| |[scam>120.01] & [ecam>1161.10] &
[133.64< f0m<=205.88]
| OR
| |[21.52< otm<=38.06] & [1252.50<
opvm<=2058.50] & [205.88< f0m<=223.94]
| OR
| |[scam>120.01] & [otm<=21.52 or
otm>38.06] & [ecam>1161.10] & [1252.50< opvm<=2058.50]
& |[f0m<=205.88 or f0m>223.94]
| OR
| |[scam<=120.01] & [21.52< otm<=38.06]
& [205.88< f0m<=223.94] |
group==> rp-with-comp |
| |[f0std<=9.87 or f0std>72.35] & [(3.87< ectm<=5.76)
or (7.66< ectm<=9.55)]& |[sctm<=17.08 or sctm>43.80]
| OR
| |[f0std<=9.87 or f0std>72.35] & [3.87<
ectm<=9.55] & [sctm<=17.08 or | | |sctm>43.80] & [4.97<
otm<=25.65]
| OR
| |[eotm<=16.82] & [25.65< otm<=33.93]
| OR
| |[eotm<=16.82] & [3.87< ectm<=5.76]
| OR
| |[f0std<=9.87 or f0std>72.35] &
[eotm>16.82] & [17.08< sctm<=30.44] & | | |[otm<=4.97
or otm>33.93]
| OR
| |[3.87< ectm<=9.55] & [30.44<
sctm<=43.80] & [otm<=4.97 or otm>25.65] |
group==> rp-without-c |
|[soam>-185.44] & [79.46< f0m<=115.58] |
|OR
||[ecam<=326.65] & [soam>-185.44] &
[8115.00< peakm<=19710.00] & [f0m>115.58] |
|OR
| |[ecam<=326.65] & [18.79< f0std<=54.50]
& [peakm<=8115.00 or peakm>19710.00]
| OR
| |[18.79< f0std<=54.50] & [ectm<=7.66
or ectm>17.12]
| OR
| |[ecam>326.65] & [7.66< ectm<=17.12]
& [8115.00< peakm<=19710.00] |
group==> chordectomy |
|[ctm<=7.80 or ctm>12.03] & [9.87< f0std<=72.35] &
[sotm<=11.51]
| OR
||[ecam>326.65] & [ctm<=7.80 or
ctm>12.03] & [9.87< f0std<=81.27]
| OR
| |[otm<=8.90] & [7.80< ctm<=12.03]
| OR
| |[otm<=8.90] & [f0std<=9.87 or
f0std>81.27]
| OR
| |[otm<=8.90] & [sotm>15.70]
| OR
| |[ecam<=326.65] & [7.80< ctm<=12.03]
& [9.87< f0std<=81.27] & [sotm>11.51]
| OR
| |[ecam<=326.65] & [ctm<=7.80 or
ctm>12.03] & [f0std<=9.87 or f0std>72.35] & | |
|[sotm>11.51] |
-
-
Table 15: Attribute strength
report of the rules in Table 14. System setup and
abbreviations are as used in Table 14.
|
| decision |
coverage |
attribute |
relative parameter strength |
| group==> control |
100 % |
otm |
0.71 |
| ecam |
0.71 |
| sotm |
0.56 |
| group==> breathy
|
100 % |
scam |
0.5 |
| otm |
0.48 |
| f0m |
0.48 |
| ecam |
0.46 |
| opvm |
0.42 |
| group==> rp-with-comp
|
100 % |
ectm |
0.54 |
| sctm |
0.44 |
| otm |
0.42 |
| f0std |
0.35 |
| eotm |
0.29 |
| group==> rp-without-c |
100 % |
f0m |
0.46 |
| ecam |
0.44 |
| f0std |
0.42 |
| soam |
0.40 |
| ectm |
0.35 |
| peakm |
0.35 |
| group==> chordectomy |
100 % |
f0std |
0.65 |
| sotm |
0.56 |
| ecam |
0.54 |
| otm |
0.54 |
| ctm |
0.46 |
Generally speaking, the results of the automated data
classification resemble the results of the statistical data
analysis (see section 21.3). The variables
used in the rules are mostly those of statistical significance. The critical
values of the parameters used in the rules agree to a large extent with the
results summarized in Table 16. Rule coverage
is full, which means that all the data is properly classified.
The parameter strength report (the relative
importance of the parameter for the validation of a given rule) reveals
interesting results (Table 15). For example, in the
hierarchy of the factors needed for the proper classification of breathy
voice, the most important one is the duration of the no-contact phase, followed
by the steepness of the start of the contact rise phase (start of closing),
F0 and the steepness of the second part of the contact rise (end of closing).
Comparing the factors that are important for classifying
the cases, one can see that the steepness of the closing phase occurs in
all rules. Duration of the closing and opening phases, peak-to-peak
amplitude, its variation and duration of the opening phase also play important
roles in this deterministic classification of data.
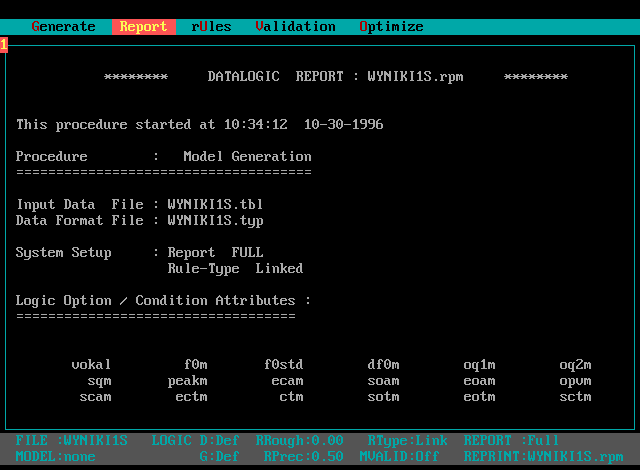
That is a screen shot from Datalogic (Reduct System) program:


